
DOM Manipulation & D3 Fundamentals
Material based on the lecture by Carlos Scheidegger, the D3 Intro by Vadim Ogievetsky, Scott Murray’s Interactive Data Analysis for the Web, and the D3 website.
DOM Manipulation
After we covered the basics of JavaScript last lecture it’s now time to explore how javascript interacts with the DOM and thus makes all the interesting things in the browser happen. Like we’ve seen before, the HTML we write is represented as a tree inside a web browser. What we are going to turn to now are the JavaScript APIs that web browsers provide to let you edit the DOM dynamically, so that we can build our visualizations with code instead of text editors.
While we will manipulate the DOM mainly through libraries (we will use mainly D3, but JQuery is the most popular DOM manipulation library) you can also manipulate the DOM directly through the standard DOM API through the document object. Check out the MDN reference on the document object.
Here are the very first steps:
See output in new page.document is a global javascript object that contains the dom. If you log the document object you will see exactly the same as in the DOM view in the web inspector. It is this object that we are manipulating dynamically and that the browser then renders. The document object contains functions, like the getElementByID method we’re using here, or the createElement or the createTextNode functions used to create new content.
Now we can make use of the features we learned about last lecture to make more complicated programs that write websites:
See output in new page.We can also control the attributes of elements, e.g., for styling and positioning with CSS:
See output in new page.Remember that in JavaScript we can attach new fields to existing objects. You can do this to DOM elements returned by the API, and that turns out to be very powerful. Note how in the snippet below, we are adding a new method update to the node returned by divWithText. When this method is called, we add the passed value to the current amount (stored at v), compute new positions from v, and update the text content of the node. By calling the update method we can get an animation:
Notice the tickForever function. We can’t use an infinte while loop here. If we did, the element attributes would be changed, but the user of the web browser does not get to see it, because the web browser does not ever get a chance to update the graphical representation of the DOM. The way to solve this problem is by using a special browser API called requestAnimationFrame. This API lets you tell a web browser that you’d like the opportunity to change something in the DOM. The next time the web browser is sitting idly, after having drawn all of its needed graphics, it will call the function passed as a parameter. Then, we just need to make sure that after updating the graphics, we call requestAnimationFrame again. The solution is a recursive version of the endless loop above (function f() { tick(); f(); }). The fundamental difference here is that instead of making the recursive call directly, we ask the browser to make the recursive call, after it has updated the graphics. This way there’s always a step in between every update where the web browser updates the UI and graphics, and you get nice animations as a result.
While we’ve worked with regular HTML elements here, the possibilities of demonstrated equally apply to SVG, of course. So in theory, you would have all the tools to create data driven visualizations. Of course, libraries such as D3 make our lives easier!
JavaScript Events
Up to this point we have only dealt with documents that are independent from user interaction. For data visualization, however, interaction is critical. Here we will introduce a couple of elementary concepts of how you can define and listen to events in JavaScript. We will be using DOM event handlers, as always, take a look at the MDN documentation.
Here is the most simple example possible for events, using two different methods:
See output in new page.The first button defines the function to be called - messageMe() directly in HTML. When the button is clicked, the corresponding function is called. The second button has an identifier. In the script we retrieve the button and add the function to be called dynamically.
onclick is of course not the only event that we can listen to. Here is an example for how to react to changes in a dropdown box with the onchange events.
Other useful events are onload, onmouseover, onmouseout, onresize, etc.
And finally, we can of course listen to events that are triggered by interacting with any kind of DOM element, not only with form elements such as buttons and drop-downs. Here is an example for SVG:
See output in new page.So far so good - you can now write interactive code! If you know how to use these events you should be able to deal with all the interaction that you will encounter in the course of this class!
Running a web server
Before we start doing data driven visualization, we need to briefly talk about web servers. All of the code we talked about up to this point can simply be run by opening any of the html files on your local computer. As we go forward, however, this will no longer be possible. Many browsers have restrictions on loading local files via JavaScript, for security reasons. So, as soon as we start working with data stored in files we need a web server to test our code. There are many different servers and you’re welcome to use whichever one you like. I’ll briefly introduce two simple solutions:
The Python SimpleHTTPServer
If you have python installed you can run the built in simple server. To do this, cd to the directory where your code is located and run the following command:
1 python -m SimpleHTTPServerOpen [http://localhost:8000/](http://localhost:8000/) to get you to the server.
You can only have one server at the same time (unless you specify ports explicitly). Hit Control-C to quit the server.
Running a Server and Debugging with WebStorm
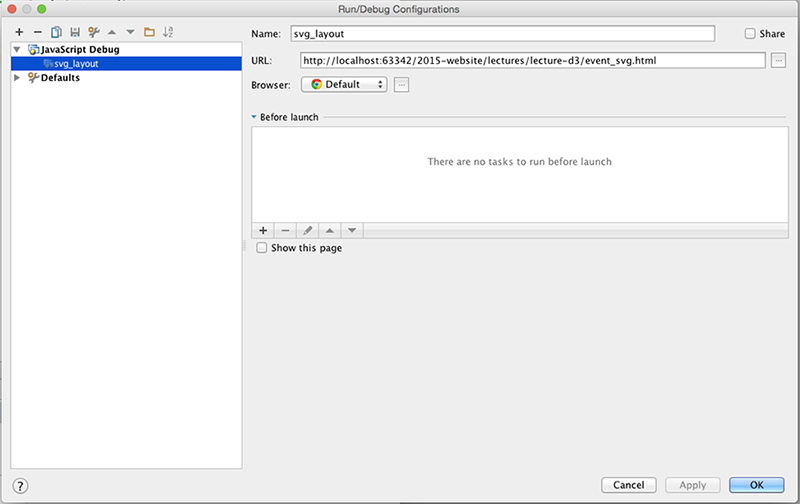
As you know, we made educational licenses of WebStorm available for you in this class. If you develop your code in an IDE like webstorm you get many powerful features, such as code completion, syntax highlighting, refactoring and interactive debuggin. While you can use the chrome developer tools to debug your code, it’s more convenient to debug the code in the place you’re writing it, as you can immediately edit if you see something wrong. To debug code, you first have to run it on a webserver. Webstorm comes with a built-in webserver, that you can activate via the Run menue. Here is an example configuration:
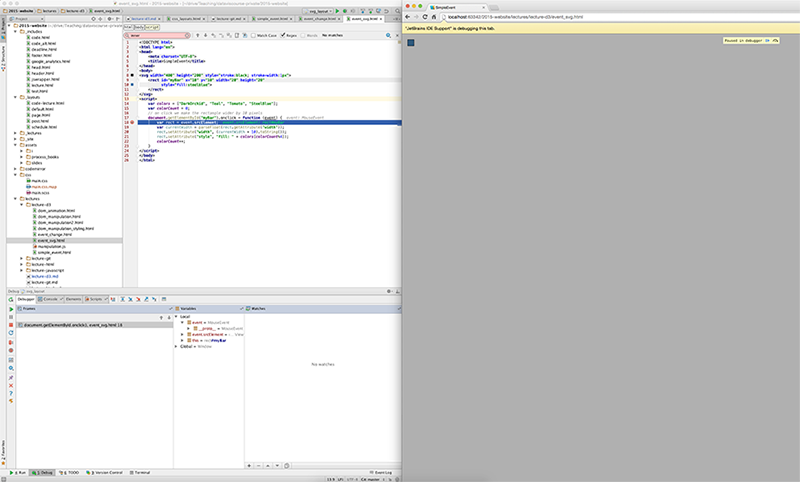
You should install the Chrome Plugin for Webstorm to get a fully-fledged debugging solution. Here I’ve set a breakpoint in the event handler function we just discussed:
Especially when you’re working on larger projects I recommend using a good IDE, as it will make you much more efficient, once you’ve learned to use it.
D3: Data Driven Documents
D3 is a javascript library for manipulating the DOM based on data. D3 was originally written by Mike Bostock, Vadim Ogievetsky, and Jeff Heer; at this point it has a large number of contributors, and it’s one of the overall most popular projects on GitHub (!). D3 certainly owes some of its popularity to riding the everything-on-the-web wave. Nevertheless, the way in which you can express relationships between data and visual elements is fundamentally superior than any other library available, open source or not! It is nothing short of a breakthrough in the way we use code to express visual encodings.
D3 can be used to manipulate pure HTML, but most commonly it’s used in combination with SVG, i.e., we will be producing SVG charts using D3.
In addition to the introduction in Scott Murray’s book (the mandatory reading) you should work with the D3 API Reference to look up particulars of all the features of D3. And of course, you should be learning by examples. A great collection are Mie Bostock’s blocks which contain simple examples, such as a bar chart to complex examples such as this calendar view.
You can download the library to run locally on your computer from the D3 Website, or you can link directly to the latest release with this snippet:
See output in new page.Selections
Here is a minimal D3 example taken from the D3 website:
See output in new page.You can see that we achieve a similar result to the DOM manipulation examples we had before. We select an existing element in the DOM, here the first <p> element, and apply a style. However, you can also see differences: instead of having to use the API standard document.getElementsByTagName we use d3.select; and instead of using setAttribute("style", "color: steelblue;") we use D3’s style method.
d3.select selects the first element that matches a selector. Selectors can specify tags (p in our example above), classes, and IDs, all through the same interface:
Notice, however, that as mentioned previously, only the first element that matches is selected. Of course, it is more practical to select all elements of a certain type, which we can achieve with d3.selectAll
The last example illustrates the declarative approach of D3: we don’t have to iterate over a list of elements and apply the style. Instead we select a set of elements through rules and declare properties.
Once you have a selection, you can bulk-modify it’s content, not only in terms of style, but we can modify arbitrary properties using selection.property(name[, value]), the textual content of the elements with selection.text([value]), etc. We can also append elements:
Here is a code snippet that we will use in future examples, included as run.js:
1 var button = d3.select("body").append("button");
2 button.text("Run!");
3 button.on("click", execute);
Here we have three SVG rectangles and use selectAll to apply a new style to them:
See output in new page.Data
Mapping existing element to data:
See output in new page.What happens if we have more datapoints than elements?
See output in new page.There are still only three elements, it doesn’t matter how many data points we have - we can’t use more than there are elements to select. What to do? Enter!
See output in new page.Progress - we have one element for each data item, but it doesn’t look good:
See output in new page.Now, that works! But we’re duplicating code. So instead we can do this shorter version:
See output in new page.So what if we don’t have initialized svg elements?
See output in new page.Now let’s try to get rid of some of the elements:
See output in new page.We have a similar problem as before - we need to remove the element that’s not bound.
See output in new page.Transitions
One of the cool features of D3 is that transitions are baked in!
See output in new page.Cool, but we’re missing the enter again:
See output in new page.Drawing Lines
Here’s one way to draw a line:
See output in new page.But we already know that. There must be something better, and there is!
See output in new page.