
How To Run a Web App Locally
Web apps made up of HTML/CSS/SVG/JavaScript can be run in the browser. Some very simple web apps can just be opened as a file.
You can try it with this file.
Whenever you load a dataset though, you will have to run a web server.
Running a web server
All of the code we talked about up to this point can simply be run by opening any of the html files on your local computer. As we go forward, however, this will no longer be possible. Many browsers have restrictions on loading local files via JavaScript, for security reasons. So, as soon as we start working with data stored in files we need a web server to test our code. There are many different servers and you’re welcome to use whichever one you like. I’ll briefly introduce two simple solutions:
The Python SimpleHTTPServer
If you have python installed you can run the built in simple server. To do this, cd to the directory where your code is located and run the following command:
1
2
3
4
# for python 2
python -m SimpleHTTPServer
# for python 3
python -m http.server
Open http://localhost:8000/ to get you to the server. You can only have one server at the same time (unless you specify ports explicitly). Hit Control-C to quit the server.
Running a Server and Debugging with an IDE
There are multiple good IDEs for web development. A common choice is Microsoft’s Visual Studio Code. An alternative are Jet Brain’s IDEs, which are available for students (check out WebStorm or PyCharm).
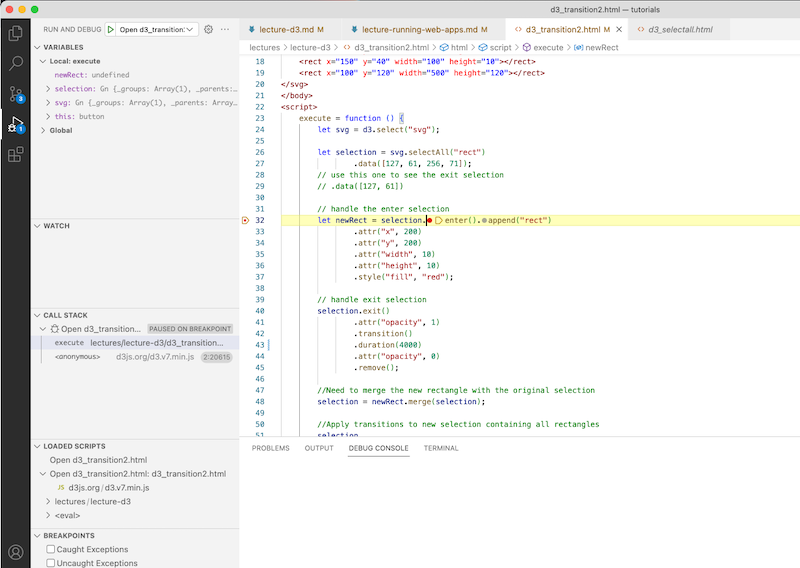
If you develop your code in an IDE you get many powerful features, such as code completion, syntax highlighting, refactoring and interactive debugging. While you can use the chrome developer tools to debug your code, it’s more convenient to debug the code in the place you’re writing it, as you can immediately edit if you see something wrong. To debug code, you first have to run it on a web server. Both, Visual Studio Code and Webstorem come with a built-in web server that you can activate via the Run menu.
For visual studio code, check out the documentation.
And this is what a debug session looks like:
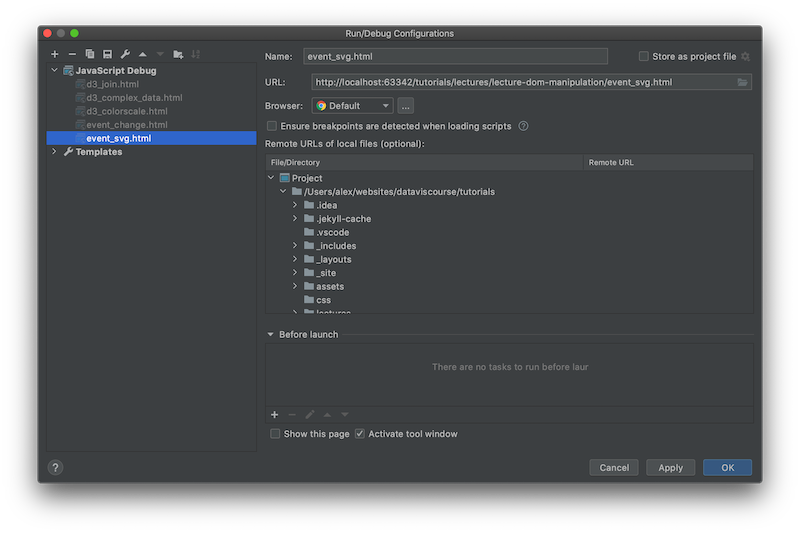
Here is an example configuration for Webstorm:
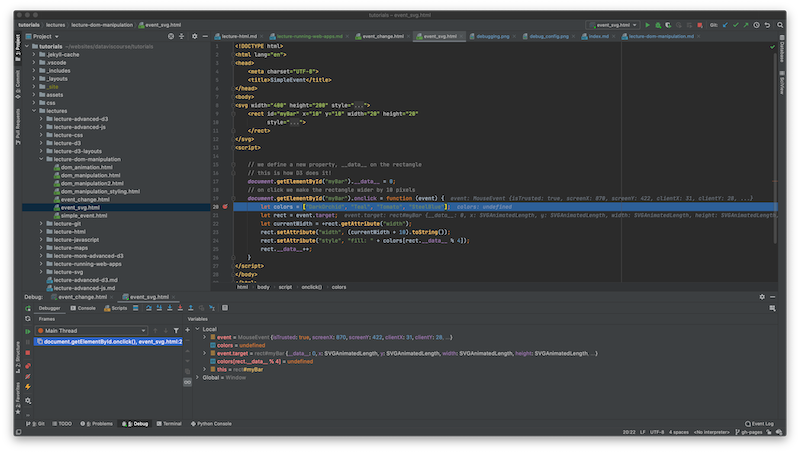
You can also just right-click an run a file!
Here I’ve set a breakpoint in an event handler function:
Especially when you’re working on larger projects I recommend using a good IDE, as it will make you much more efficient, once you’ve learned to use it.