
More Advanced D3
Brushes
One of the most important interactions you can add to your visualization is brushing. Brushing interaction allows one to select a subset of data in a visualization. This is designed to allow users to highlight data points in the same view or across multiple linked views, which in turn makes it possible to see relationships between points in these multiple views. Brushing is also used to select discrete elements, such as dots in a scatterplot or files on a desktop. It can also be used to zoom-in to a region of interest, highlight a region of interest, or any possible task you can think of for doing with selections.
More technically, brushing in D3 is the interactive specification of an one or two-dimensional selected region using a pointing gesture, such as by clicking and dragging the mouse.
The simplest possible brush is rectangular brush. Here’s an example:
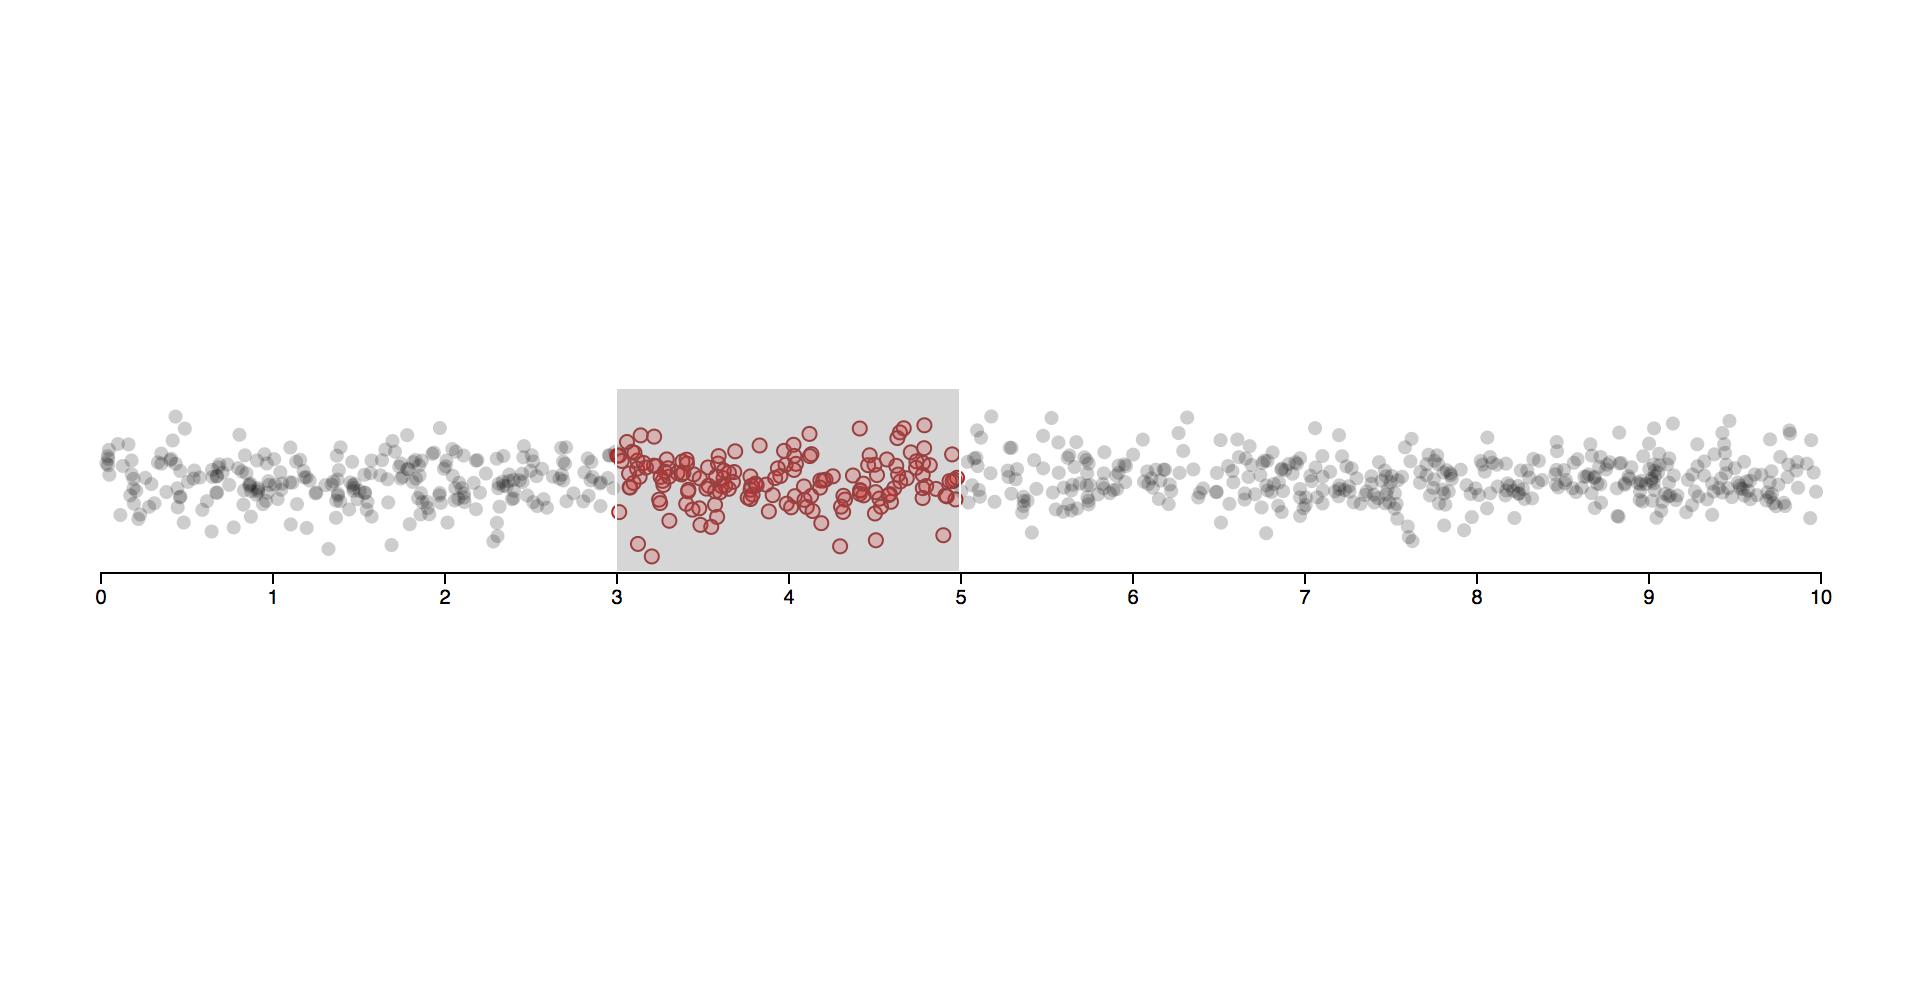
Brushing with d3
The source code and documentation for d3 brush implementation is location here.
There is a gallery for different possible brush implementation using d3 at this link.
d3 allows us to create 3 different types of brushes:
brushXfor brushing across X axisbrushYfor brushing across Y axisbrushfor brushing in both dimensions at once.
Creating any of the above brushes follows a similar procedure:
First we select or append a group element which will house our brush.
const brushGroup = d3
  .select("svg")
  .append("g")
  .classed("brush", true);
We initialize a d3 brush function as follows:
const brush = d3.brush();
const brushX = d3.brushX();
const brushY = d3.brushY();
Depending on type of brush we use, we also need to specify certain parameters to it. The most important parameter is the brush extent. This is a two dimensional array such as [[left, top],[right, bottom]] and specifies the top left and bottom right corner of the area.
const brush = d3.brush().extent([0, 0], [width, height]);
After this step the variable brush is a function which will add a brush overlay to our code. We do not call this function directly, but we use the syntax similar to we use for d3.axis:
brushGroup.call(brush);
Let us take a look at a working code example:
See output in new page.Right now the brushes don’t do anything exciting but just draw rectangles on the screen. We need to attach events to the brush to do something meaningful with them.
D3 Brush events
d3 exposes three brush events:
start: This is triggered at the start of brush gesture, e.gmousedownandtouchstart.brush: This is triggered when the brush moves or resizes.end: This is triggered at the end of brush gesture, e.g.mouseupandtouchend.
Let us look at a working example on a scatterplot. We will use the iris dataset.
D3 Groups
We will cover two d3 functions which might help you out. d3.groups and d3.group.
As its name suggests, d3.group groups values by key. It returns a map from key to the corresponding array of values from the input.
Let us look at a code snippet:
See output in new page.This returns a map object where key is each unique value you grouped on and the value is an array of all objects belonging to the key.
d3.groups does something similar:
d3.groups just returns the same thing in a nested list format. This is pretty useful for binding with d3 without having to use d3.entries.
You can also nest on multiple keys, this just returns a nested map:
See output in new page.Linked Views
Designing a complex visualization is always a challenge. There are multiple questions like: How do we structure our code-base? How do views communicate with each other?
An object oriented approach is usually a really easy and beginner friendly way to design your multi-view visualization with interactions between them. We’ve split the following example up into three files. We first show the file that glues everything together, followed by the ScatterPlotWithBrush and ScatterPlot class.
Let us take a look at individual classes and compare how the code is structured.
Scatterplot With Brush
Regular Controlled Scatterplot
Using D3 with other front end libraries
If you are working on a large project where data visualization is a part, there is a good chance that you are using some front end framework like React:
Most of the frameworks above have dedicated data visualization libraries written for them, here are some links:
You can find more such libraries for any other framework you use.
The other approach is to use D3 in conjunction with your library. There are multiple approaches to this, we will just discuss those on a higher level:
- Make React call D3 render functions
- Pros: Easy to setup.
- Cons: Both try to control DOM and may lead to serious performance issues because both libraries do not respect each others renders.
- Allow D3 and React to control their own setup by creating D3 visualization as black-box components
- Pros: Quite fast if setup correctly.
- Cons: Tricky to setup correctly and needs a bit of underlying knowledge about how both React and D3 handle DOM updates, else causes same problems as above approach.
- Allow React to control DOM and use D3 to do calculations like scale and layouts
- Pros: Super fast (of course if you use React properly).
- Cons: Almost no documentation on using React and D3 in this way.