
Homework 1
Most of what a visualization practitioner does on the job is decide which tool fits a task, not produce code once that decision is made. This assignment puts that decision in miniature. You will build the same three charts twice from the same dataset: once in Vega-Lite, a high-level grammar that is fast and consistent but limited in what it can express, and once in D3, which trades that speed for pixel-level control. The point is not to memorize D3 method chains or Vega-Lite JSON keys. Instead, the point is to understand where each tool’s ceiling is, so that you know which one to reach for in the future.
The Data
You will work from a real, moderately messy dataset for all three charts: Our World in Data’s COVID-19 case data, alongside a world map. It has temporal, quantitative, categorical, and geographic fields, and missing values.
data/
    owid-covid.csv   # iso_code, location, date, total_cases_per_million
    world.json        # TopoJSON country outlines (id = ISO alpha-3 code)
owid-covid.csv mixes two kinds of rows: per-country records, and per-continent rollups whose iso_code starts with OWID_ (e.g. OWID_AFR). Which rows a given chart needs is a decision you make in your spec, not something decided for you.
Getting Started
We will create a starter repository for you under https://github.com/dataviscourse2026. If you can’t find your repository there, contact course staff as soon as possible. It contains:
data/                # shared by both toolchains — do not modify
index.html            # the report — fill in Specs first, see Step 1
index-d3.html
index-vl.html
d3/
    styles.css
    script.js       # data loading and app state — done for you
    map.js           # Chart C, stub
    line-chart.js     # Chart B, stub
    bar-chart.js       # Chart A, stub
vega-lite/
    map.vl.json
    line-chart.vl.json
    barchart.vl.json
    README.md         # data facts you need (topojson id, OWID_ rows, etc.)
Add your name, email, and UID at the top of index.html and of both index-d3.html and index-vl.html.
index.html is the front page of your submission: it holds your written report (Specs, Deviations, AI Use) and embeds index-d3.html and index-vl.html in iframes, each with a link to open it in its own tab.
You’ll need to be serving the repo directory, not opening the HTML files directly, for the data fetches (and the iframes) to work. If your environment doesn’t provide a built-in server, start one from the root of the repo:
$ cd path/to/repo
$ python -m http.server 8000
Then view your report, with both builds embedded, at http://localhost:8000/index.html.
Steps
1. Write the specs — before writing a single line of chart code
Design three charts against this dataset:
- Chart A — Comparison, as a bar chart.
total_cases_per_millionbroken out by continent (categorical × quantitative). - Chart B — Trend, as a line chart.
total_cases_per_millionover time (temporal × quantitative). - Chart C — Geography, as a choropleth map.
total_cases_per_millionby country, on the world map (geographic × quantitative).
For each chart, write down in the Specs section of index.html:
- The question the chart answers.
- The marks and encoding channels you chose (x, y, color, etc.).
- One line of perceptual justification for each encoding choice — why that channel for that field, not another chart type.
- An explicit decision for how you will deal with missing values in that chart.
Chart B and Chart C are also linked in the D3 build only: selecting a country on the map filters the line chart to that country, and a “Clear Selected Countries” button resets it. Write the interaction spec for this too (what triggers what, what state changes, what a hover shows) before implementing it. The Vega-Lite versions of all three charts are static; you are not required to reproduce the linking in Vega-Lite.
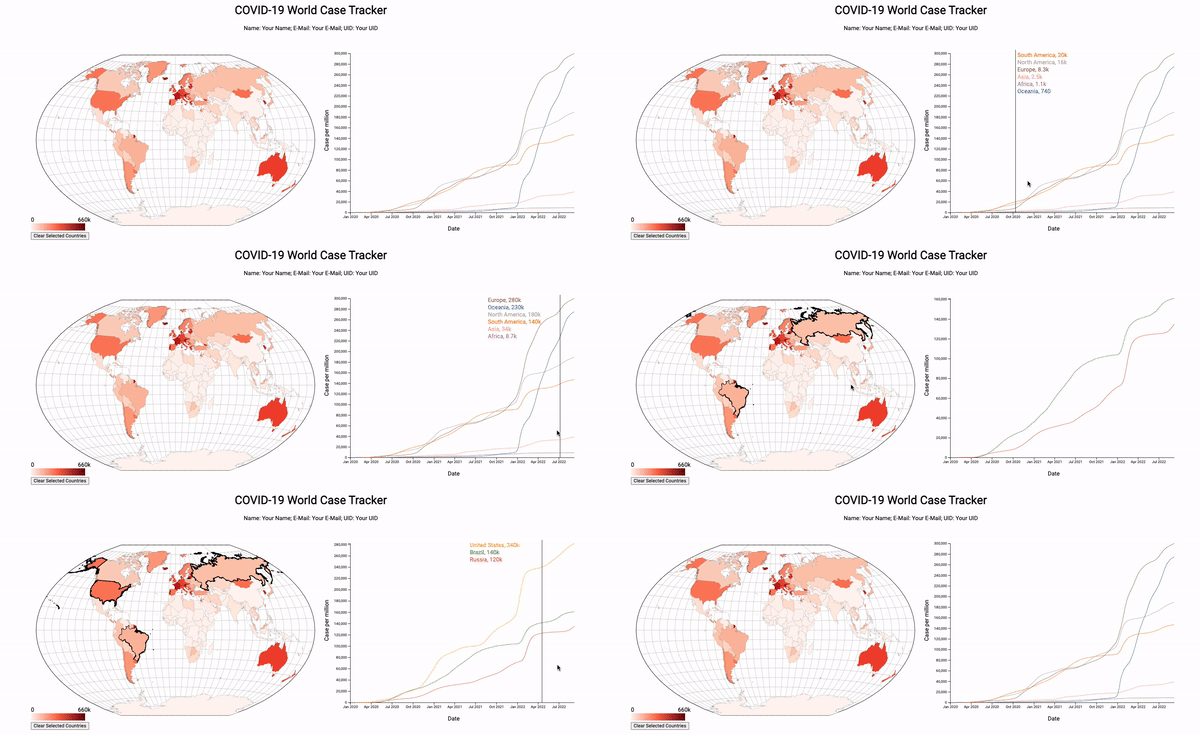
Commit the Specs section of index.html before you write any implementation code. The commit timestamp is the evidence that the spec came first (do not edit it once implementation begins). If a toolchain later forces you off the plan, that goes in the Deviations section, not a rewrite of the spec.
2. Implement the three charts in Vega-Lite
Fill in the three stub specs in vega-lite/ to match your Specs. Where the grammar cannot express what you specified, implement the closest faithful version and log the gap in the Deviations section of index.html: what you specified, what Vega-Lite could or couldn’t do, and what you did instead.
3. Implement the same three charts in D3 — by hand
Fill in map.js, line-chart.js, and bar-chart.js. No chart libraries beyond what the starter already includes (d3, d3-geo-projection, topojson). Build the map and line chart to the interaction spec from step 1. Same rule as step 2: log any deviation rather than silently redesigning.
4. Disclose your AI use
You may use an LLM or coding assistant for help understanding syntax and debugging errors in either toolchain. The LLM should not write chart code for you. In the AI Use section of index.html, log what you asked, what came back, and what you kept, changed, or rejected and why. A disclosure that only shows syntax lookups and debugging is expected and fine; one that reads like the assistant produced the chart logic is not.
Deliverables
Your repository, containing:
index.html— Specs (data notes, the three chart specs, and the interaction spec, committed before implementation), Deviations, and AI Use, withindex-d3.htmlandindex-vl.htmlembedded as iframesd3/— the three D3 charts, with the map/line-chart linking implementedvega-lite/— the three Vega-Lite specs, static and independent
Submission
Submit by committing and pushing to your GitHub repository. Your last commit before the deadline is your submission — there is no separate Canvas or file upload step.
Grading
- 20% — Specs: clear questions, defensible encoding choices, a stated missing-value decision, an interaction spec for the D3 linking, all written before implementation (verified against commit history)
- 25% — D3 implementation of all three charts, faithful to spec (or a logged, justified deviation)
- 15% — D3 interaction: map-click selection filters the line chart, hover shows values, clear button resets
- 20% — Vega-Lite implementation of all three charts, faithful to spec (or a logged, justified deviation)
- 10% — Missing values handled consistently with the stated decision
- 10% — AI-use disclosure: specific and consistent with syntax-and-debugging use, not code generation