
Group Activity: Design Critique
A useful critique does more than say whether you like a visualization. It works out what the data is, what the author was trying to say, how the design encodes it, and where the design helps or gets in the way, and it ends with a concrete way to do better. In this activity, your group will critique six published visualizations using the same set of questions we worked through in lecture.
Instructions
- Form a group of 2–4 people.
- Create a shared Google Doc. Add everyone’s name, and set the permissions so that course staff can access it.
- For each of the six visualizations below, answer the critique questions. A few sentences per question is enough, but be specific: point to the part of the visualization you are talking about.
- Submit your document using the Google Form on the course website. One submission per group, with everyone’s names included.
Critique questions
- What is the data shown in this visualization?
- What might be the intention of the author?
- What are the marks, and what are the channels?
- Is the Effectiveness Principle followed? (Is the best visual channel used for the most important data?)
- Is the Expressiveness Principle followed? (Does it show just the data, or also useful embellishments?)
- Are the scales and legends appropriate?
- Is the context appropriate?
- Is the chart type or layout appropriate?
- What about color?
- Why do you like or dislike this visualization?
- Can you suggest any improvements? How would you redesign it?
Visualizations
Visualization 1

Source: Stock Region (@stockregion), Instagram.
Visualization 2
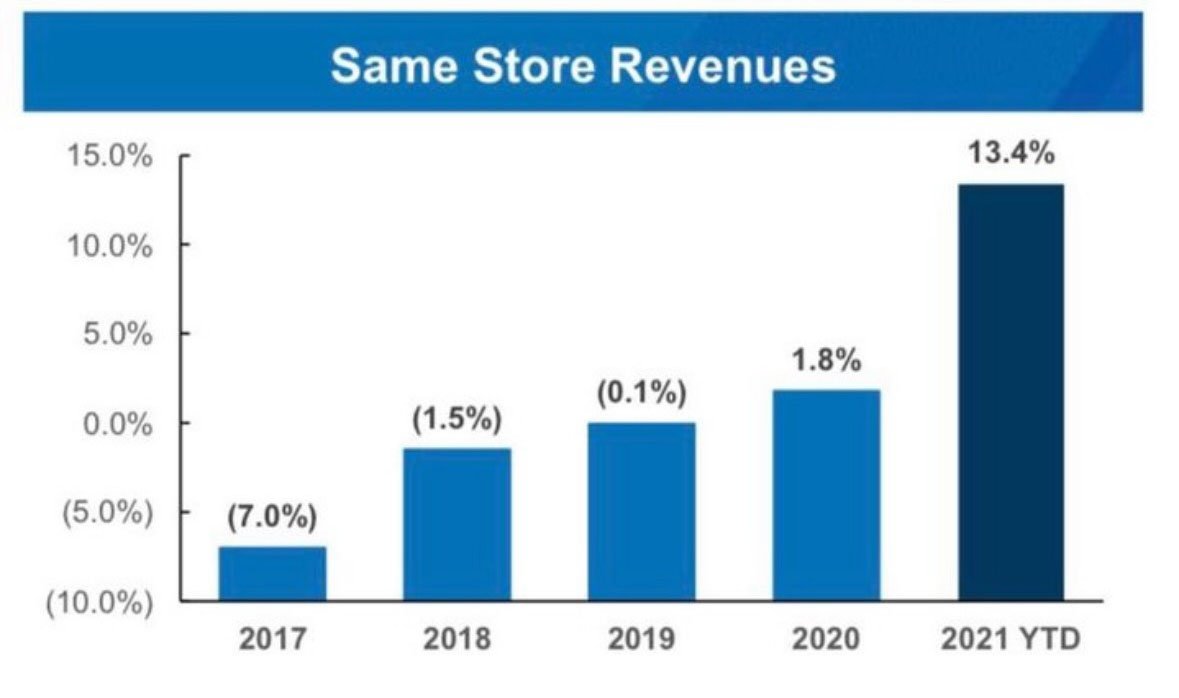
Source: a company investor presentation.
Visualization 3

Source: Visual Capitalist, “20 Years of Internet Giants”.
Visualization 4
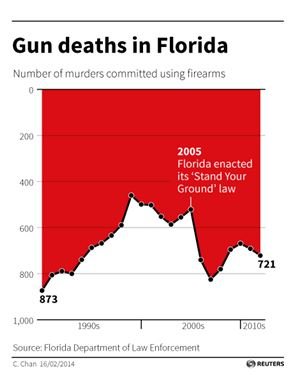
Source: C. Chan, Reuters, February 2014, using data from the Florida Department of Law Enforcement.
Visualization 5
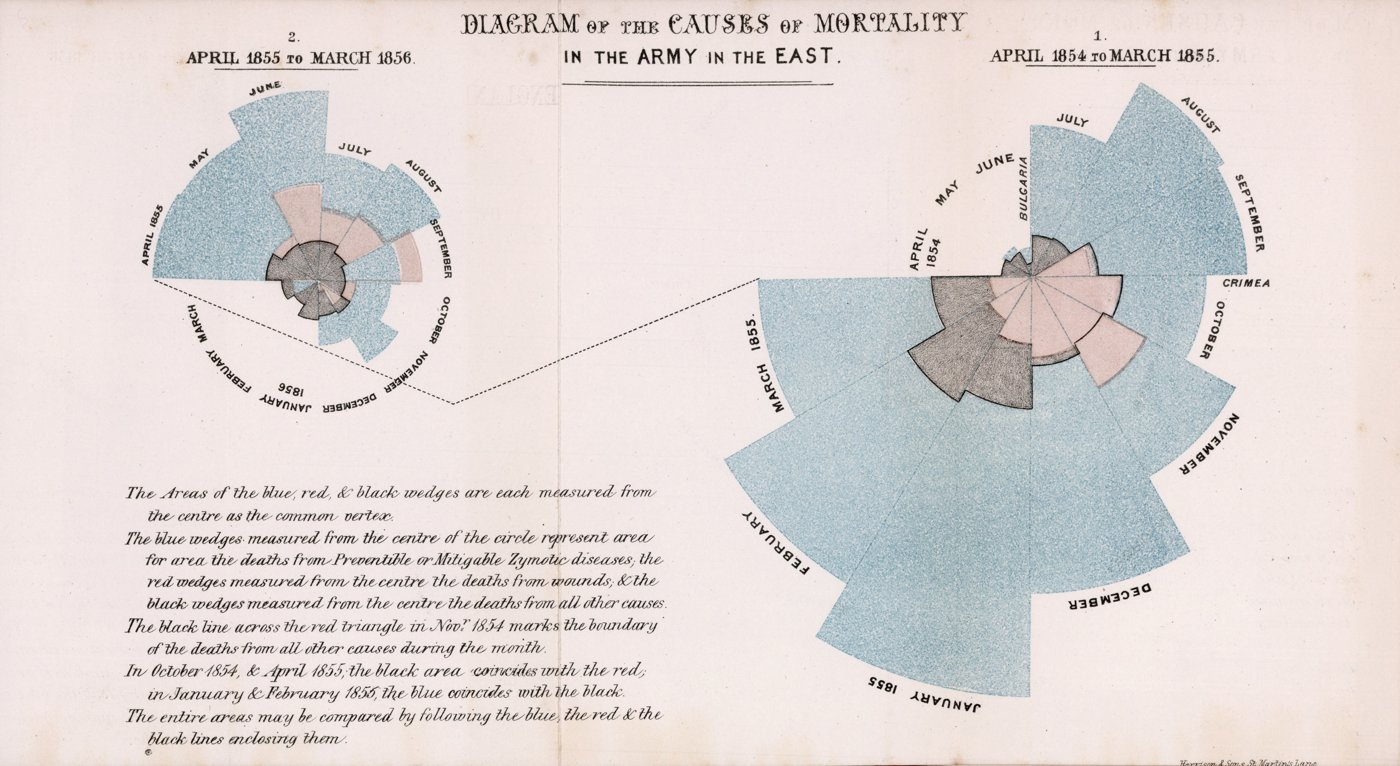
Source: Florence Nightingale, “Diagram of the Causes of Mortality in the Army in the East,” from Notes on Matters Affecting the Health, Efficiency, and Hospital Administration of the British Army (1858). Wikimedia Commons (public domain).

Visualization 6
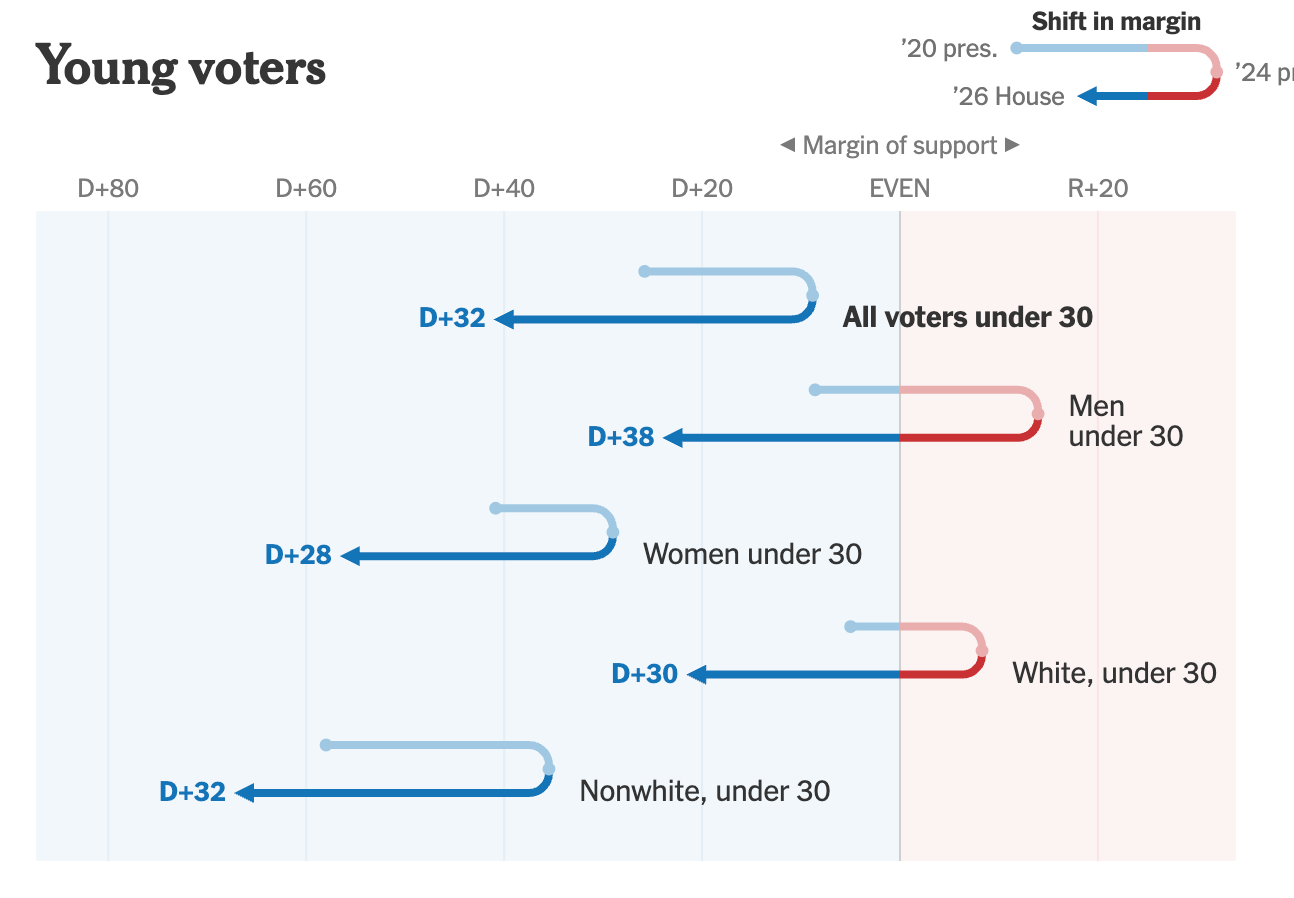
Source: The New York Times, November 4, 2026.